
Have you ever noticed how a 1-year CDB pays one rate, while a 5-year CDB offers a much higher rate? This difference is directly related to the yield curve, which helps explain the time value of money.
In practice, it influences B3 Interest Rate Futures, Treasury securities, and bank offerings. According to the Central Bank, the benchmark rate serves as a reference for various market decisions, including in the Impact of the Selic Rate on Fixed Income.
What is a yield curve?
Simply put, the curve shows the relationship between maturity and interest rates. In general, the longer the maturity, the higher the premium the market may demand for lending money.
This happens because investors want compensation for waiting longer. When we talk about How the yield curve works, we're looking at the cost of money today, a few months from now, and also several years from now.
It isn't fixed. One day, the short end may be high; another day, the long end rises more. This changes the interpretation of inflation, risk, and future expectations.
“The interest rate on a contract depends on its term and market conditions at the time of the transaction.” — Bank Central do Brasil, in educational materials on tax calculation.
Why does the curve change over time?

The main reason is the market's expectations regarding inflation and monetary policy. If investors believe that the Copom If the Selic rate rises, longer-term interest rates tend to react first.
Market sentiment and fiscal risk also come into play. When there is greater uncertainty, investors typically demand higher interest rates for long-term investments, and this affects the yield curve.
In our market-reading tests, the most common pattern is this: the short term reacts quickly to the Selic rate; the medium and long terms reflect market expectations. As a result, the same news can affect different segments of the yield curve.
If projected inflation falls, the yield curve may flatten. If the market fears rising prices or a worsening fiscal situation, the curve tends to steepen, especially at longer maturities.
How it affects fixed-income securities
In the fixed-income market, the yield curve It affects the price of securities before maturity. Those who buy and sell before maturity feel this fluctuation more directly than those who hold the security until maturity.
Let's look at a simple example: a fixed-rate security purchased at a rate of 10% per year may become more valuable if the market starts demanding 9%. If you sell it beforehand, you may make a profit. If the market rate rises to 11%, you may incur a loss.
This applies to both government and private securities. In practice, the yield curve affects the value of debentures, CDBs fixed-rate securities as well as Treasury securities whose prices fluctuate with the market.
The key point is this: the contracted yield and the price on the secondary market are not the same thing. This detail significantly affects the outcome for those who do not intend to hold the investment until maturity.
Yield Curve and Tesouro Direto
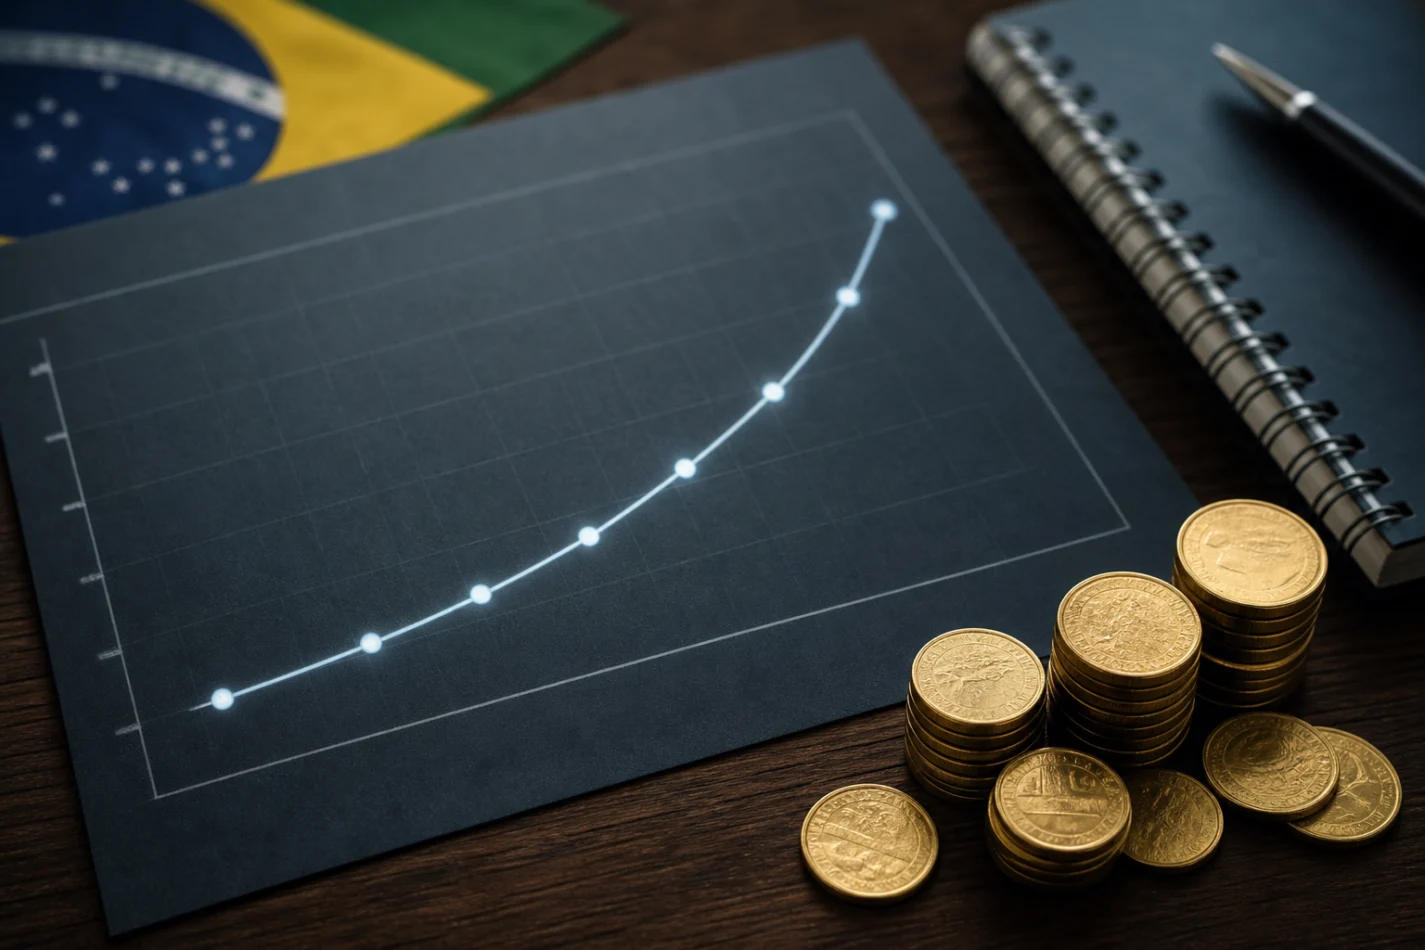
In Treasury Direct, a yield curve It features prominently in three major categories. Each responds in its own way to the Selic rate, inflation, and future expectations.
O Selic Treasury It is usually the most stable option for those who want an emergency fund or liquidity. Fixed-rate and IPCA+ bonds, on the other hand, are more susceptible to fluctuations in the yield curve, especially if sold before maturity.
| Title | How does it respond to the curve? | Profile/Objective | Mark-to-market risk |
|---|---|---|---|
| Selic Treasury | It tracks the Selic rate and fluctuates little in the short term | Emergency reserve and short-term goals | Bass |
| Prefixed Treasury | The value fluctuates significantly when market interest rates change | Those who accept volatility and believe interest rates will fall | High |
| IPCA+ Treasury | It combines inflation with the real interest rate and reacts to the long end of the yield curve | Medium- and long-term goals, such as retirement | Medium to high |
A practical example helps. If you buy a Fixed-Rate Treasury Bond 2029 At an annual rate of 10.5%, and then, if the market begins to demand 11.5%, the security's price may fall partway through.
The IPCA+ Treasury Bond 2035 It tends to be more useful for protecting purchasing power in the long term. It makes the most sense for those who want to combine real returns with a longer investment horizon and are willing to accept fluctuations until maturity.
The impact on CDBs, LCIs, and LCAs
At banks, the logic is similar. When the yield curve When it rises, issuers need to offer higher rates to attract money. When it falls, offers tend to decrease.
That's why a CDB The daily liquidity facility may pay 100% of the CDI at one point and 110% at another. The bank adjusts the offer based on funding costs and market conditions.
Here is a practical overview of what individual investors can expect under different time-horizon and liquidity scenarios.
| Product | Common example | Liquidity | When it usually attracts |
|---|---|---|---|
| CDB daily liquidity | CDI rates from 100% to 110% at medium-sized banks | Daily | Reserves and Short-Term Cash |
| Fixed-rate CDB | 12% per year for longer terms | On the due date | Anyone who wants a fixed rate and is willing to wait |
| LCI | CDI rates from 90% to 95%, with income tax exemption for individuals | Usually on the due date | Conservative investor seeking tax efficiency |
| LCA | CDI codes 92% through 98%, which are also exempt from income tax for individuals | Usually on the due date | Who wants a bank loan with tax benefits? |
One CDI CDB 120% It may seem better than a CDI 94% LCI, but taxes change the equation. For some terms, the net return is very close. That’s where you need to take your time when making the comparison.
It’s also worth noting the difference between daily liquidity and long-term maturity. A longer-term security usually pays more, but it ties up your money and may fluctuate if you need to cash out early.
When Mark-to-Market Matters
A marking to market It is the mechanism that adjusts the price of the security based on current interest rates. If the yield curve When it changes, the stock's selling price also changes.
Imagine a fixed-rate security that promises to pay R$ 1,000 at maturity. If the market rate falls, that future cash flow is worth more today. If the rate rises, it’s worth less. That’s how temporary gains or losses arise.
Here's a simple example: You buy a security that will pay R$ 1,000 in two years, compounded at 10% per year. If market interest rates fall to 8%, the theoretical price rises. If you sell, you can pocket that gain.
But the opposite also happens. If the rate rises from 10% to 12%, the price falls. Therefore, the yield curve It has a greater impact on those who do not hold the investment until maturity.
How to Use the Curve in Your Strategy
The best use of the yield curve It's not about trying to predict the future. It's about aligning the timeline, the goal, and the product. That way, you avoid buying a security that doesn't match your cash flow needs.
In practice, we've observed that novice investors make fewer mistakes when they start with the goal in mind, rather than the rate. First comes the time horizon; next, the type of return; and finally, the choice between liquidity and return.
- Emergency reserve: Prioritize Selic Treasury or CDB with daily liquidity from a reliable bank.
- Goal within 2 years: Consider CDBs and LCIs/LCAs with maturities that align with the date of the expense.
- Long-term goal: Look at IPCA+ Treasury and securities that protect purchasing power.
- Search for a locked rate: Compare fixed-rate plans only if you can wait until maturity.
If you want to better understand the effect of interest over time, it's also worth studying Compound Interest in Practice. In fixed-income investments, time and interest rates go hand in hand.
Common Mistakes When Investing in High-Interest Investments
When interest rates are high, many people rush to choose the most attractive rate. This impulse can lead to poor choices, because the yield curve provides information beyond the main number listed in the storefront.
A common mistake is to compare only the gross rate. A CDB of 12.51 TP3T per year It may yield less cash than a smaller LCI, depending on the term and taxes. The number on its own is misleading.
Another mistake is ignoring the redemption date. Investing in a long-term security without knowing whether you’ll need the money sooner is a recipe for frustration, especially if the price drops along the way.
It also happens that investors forget the income tax in taxable securities. A gross gain of 10% is not the same as a net gain of 10%. This distinction changes the comparison between similar products.
If the topic of profitability still seems confusing, I recommend reading dangerous compound interest, because the math behind the deadline can catch people off guard if they only look at the beginning of the calculation.
The Roadmap to Getting Out of Savings
A yield curve It helps you understand market conditions, but it is no substitute for planning. The safest way to withdraw from your savings account starts with an emergency fund, involves clearly defined time frames, and progresses according to your financial profile.
For those just starting out, it’s usually best to prioritize Selic Treasury or CDB with daily liquidity. Then, it makes sense to evaluate LCI, LCA and fixed-rate or inflation-indexed securities, always considering maturity, tax implications, and risk.
If you want to stay on top of the market and understand why rates change, it's also worth keeping an eye on analyses of yield curve and the data from the Central Bank. This helps you make more informed decisions.
Instead of chasing the “perfect rate,” develop a strategy that aligns with your goal. In the end, that’s what makes the difference: using the yield curve as a reading tool, not as a gamble.
This content is for educational purposes only and does not constitute an investment recommendation. Consult a certified financial advisor before making any decisions.
Frequently Asked Questions About the Yield Curve
What is the yield curve, and why is it important for fixed-income investments?
The yield curve shows how interest rates vary depending on the investment term. It is important because it influences the price of securities before maturity, the expected return, and comparisons between short-, medium-, and long-term investments.
How does the yield curve affect CDBs, Tesouro Direto, and debentures?
It affects the rate the market charges for lending money at different maturities. When rates rise, fixed-rate and market-indexed securities may lose value on the secondary market; when rates fall, these securities tend to appreciate in value.
What factors cause the yield curve to change over time?
The main changes stem from expectations regarding inflation, the Selic rate, Copom decisions, fiscal risk, and market sentiment. In general, the short end reacts more quickly to monetary policy, while the long end reflects future projections.
Is it better to invest in the short term or the long term when the yield curve rises?
It depends on the objective. If the curve rises due to uncertainty, longer maturities typically command a higher premium but are also more volatile. Shorter maturities, on the other hand, tend to react more quickly and may offer less risk of fluctuation.
Is it a myth that only the contracted yield matters, and not the yield curve?
Yes, it's a myth. The contracted yield is valid until maturity, but anyone who sells before then needs to consider the market price, which is influenced by the yield curve. This can turn an expected return into a gain or a loss.