
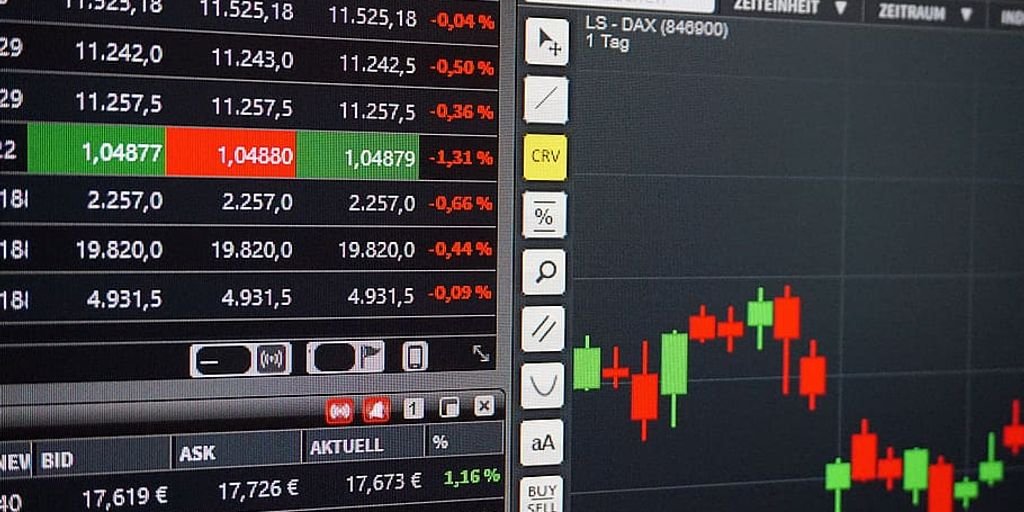
Graphical analysis, also known as technical analysis, is a methodology widely used in the financial market to predict future price movements based on historical patterns and statistics. By mastering this technique, investors can make more informed decisions and increase their chances of success in the financial markets. actions, options and futures. This article explores how graphical analysis can improve your investment decisions, providing a detailed overview of its tools, interpretations, advantages, limitations and strategies.
Key Takeaways
- Graphical analysis helps to identify price trends and repetitive patterns that may indicate future movements.
- Tools such as moving averages, RSI and Bollinger Bands are essential for effective technical analysis.
- The correct interpretation of price charts, including candlestick patterns and support and resistance levels, is crucial.
- Although it offers advantages such as quick decisions and flexibility, graphical analysis also has risks and limitations, such as false signals.
- Integrating graphical analysis with fundamental analysis can provide a more complete and assertive view of the market.
What is Chart Analysis
Graphical analysis, also known as technical analysis, is a method used to evaluate shares and other financial assets. It is based on observing the performance charts of prices over time, seeking to identify patterns and trends that may indicate future movements in the market. This technique is widely used by investors who want to make informed decisions quickly.
Definition and Basic Concepts
Graphical analysis involves the study of graphs that represent the variation in asset prices. These graphs help you visualize market behaviour and identify possible buy and sell points. The idea is that by understanding past patterns, you can predict future movements.
History of Graphical Analysis
Graphical analysis has its roots in the 18th century, with the first price charts appearing in Japan. In the West, it gained popularity at the beginning of the 20th century, with the publication of books and studies that formalized its techniques and concepts. Since then, graphical analysis has evolved and become an essential tool for many investors.
The Difference Between Chart Analysis and Fundamental Analysis
While graphical analysis focuses on price movements and market patterns, fundamental analysis concentrates on a company's economic and financial fundamentals. Both approaches can be complementary, offering a more complete view for making investment decisions.
Main Tools of Graphical Analysis
To make more informed decisions when investing smartly, It is essential to know the main tools of graphical analysis. These tools help identify trends and patterns in asset prices, allowing for more accurate and effective analysis.
How to Interpret Price Charts
To make informed decisions in the financial market, it is essential to know how to interpret price charts. Understanding the different types of graphs and how they represent the evolution of quotes over time can give you a significant advantage.
Types of Charts
There are several types of charts you can use, each with its own particularities:
- Line Chart: Represents the quotes of a time interval joined by a straight line. It is simple and easy to understand, ideal for visualizing general trends.
- Bar ChartShows the evolution of quotes through vertical bars, where each bar represents the high, low, open and close of a specific period.
- Candlestick chartAlso known as the Japanese chart, it originated in the 17th century in Japan. It is widely used by analysts because it represents the evolution of prices in detail and allows visualization of the quantity traded.
Candlestick Patterns
Candlestick patterns are specific formations that help predict future price movements. Some of the most common patterns include:
- HammerIndicates a possible reversal from a downtrend to an uptrend.
- Shooting StarSignals a possible reversal from an uptrend to a downtrend.
- Diamond: The graphic figure diamond signals possible trend reversals, This is formed by an expansion followed by a contraction in prices.
Supports and Resistors
Supports and resistances are price levels where the asset tends to encounter buying or selling pressure, respectively. Identifying these levels can help you make more informed decisions about when to enter or exit a position.
Knowing how to identify support and resistance is crucial to avoid entering trades at the wrong time and maximize your profits.
Advantages of Graphical Analysis
Graphical analysis offers a number of advantages that can help you take investment decisions more informed and effective. Let's explore some of these advantages below.
Limitations and Risks of Graphical Analysis
Although graphical analysis is a powerful tool, it does have its limitations and risks, which you should be aware of before using it. False signals are one of the main problems, as they can lead to rash decisions and financial losses. The reliance on historical data is another significant limitation, as past market behavior does not guarantee future results. In addition, there is the risk of over-interpretation, where you can end up seeing patterns where there aren't any, leading to high-risk investments.
It is crucial to be aware of these risks and always seek information before investing, in order to minimize possible losses.
Common Strategies in Chart Analysis
In Day Trading, In this way, you buy and sell assets on the same day, taking advantage of small price fluctuations. This strategy requires constant attention to the market and a quick decision-making. It is ideal for those who have the time and want to profit from short-term movements.
O Swing Trading involves holding positions for a few days or weeks in order to capture more significant price movements. This approach allows for more detailed analysis of the charts and less need for constant monitoring compared to day trading.
Scalping is a strategy that focuses on small, frequent gains by making several trades throughout the day. The idea is to take advantage of minimal price variations, requiring fast and precise execution. It's a technique that can be profitable, but also requires strict risk management.
When choosing a strategy, it is essential to consider your investor profile and the time you can devote to the market. Each approach has its advantages and challenges, and the key to success lies in consistency and discipline.
How to Integrate Chart and Fundamental Analysis
Integrar a análise gráfica com a análise fundamentalista pode ser uma estratégia poderosa para melhorar suas decisões de investimento. Enquanto a análise gráfica foca no curto prazo, a análise fundamentalista oferece uma visão de longo prazo, considerando fatores como fluxo de caixa e balanço patrimonial. Combining these two approaches allows you to have a larger and more precise window of opportunity.
Benefits of Integration
Combining the two analyses provides a more solid basis for your decisions. You can use graphical analysis to identify entry and exit points in the short term, while fundamental analysis helps you assess the company's financial health and growth potential in the long term. This results in a more robust investment portfolio aligned with your objectives.
Practical examples
Imagine that you are analyzing a stock which, according to graphical analysis, is about to break through important resistance. At the same time, fundamental analysis shows that the company has a positive cash flow and a healthy balance sheet. This combination of factors can increase your confidence in the decision to invest.
Complementary Tools
There are various tools that can help integrate the two analyses. Graphical analysis software often includes fundamental indicators, allowing for a more complete view. In addition, platforms such as infomoney offer comprehensive content on investments, the economy and markets, making it easy to obtain the information needed for both analyses.
Common Mistakes When Using Graphical Analysis
Ignoring the Market Context
One of the most common mistakes is ignore the market context. Graphical analysis can provide valuable signals, but if you don't consider external factors such as economic news or political events, you could end up making the wrong decisions. For example, news about changes at Inter can drastically affect the behavior of an asset, regardless of what the charts indicate.
Overconfidence
Another common mistake is overconfidence. Graphical analysis can be a powerful tool, but it is not infallible. Many investors end up blindly trusting the charts and ignoring other important signals. This can lead to big losses, especially in a market as volatile as the stock market.
Neglecting Risk Management
Finally, neglecting risk management is a serious mistake. Even if the graphical analysis indicates a positive trend, it is crucial to always have a contingency plan. Define LOSS LIMITS and knowing when to exit a position can be the difference between success and failure. Remember, the financial market is unpredictable and risk management is essential to protect your capital.
Resources and Platforms for Graphical Analysis
For those starting out in graphical analysis, choosing the right platform can make all the difference. There are several technical analysis platforms available, both paid and free, which offer a variety of tools to help you understand market trends. You can contract directly through the broker's portal or access them for free via the home broker.
Popular software
Some of the most popular platforms include Metatrader 5, ProfitPro and Tryd Pro. These tools are widely used by traders due to their robustness and variety of features. They allow you to customize indicators and create automated strategies, which can be a big plus for those who want to delve deeper into technical analysis.
Customizable indicators
One of the great advantages of these platforms is the possibility of customizing indicators. This means that you can adjust the tools according to your specific needs, making analysis more precise and efficient. Indicators such as moving averages, RSI and Bollinger Bands can be configured to provide clearer and more assertive signals.
Communities and Forums
As well as tools, online communities and forums are valuable resources for those who want to learn more about graphical analysis. In these spaces, you can exchange experiences, ask questions and even find mentors who can help you develop as a trader. Participating in these communities can accelerate your learning and provide valuable insights into the market.
Case Studies: Success with Graphical Analysis
Mastering the graphic analysis is one of the prerequisites for winning in the financial market. Many successful traders attribute their success to their ability to interpret graphs and identify trends. One notable example is João Silva, who managed to multiply his capital in just a few years using graphic analysis strategies.
To understand how profitable graphical analysis can be, let's take a look at some successful trades. João Silva, for example, used candlestick patterns to predict bullish movements in technology stocks. In one of his trades, he identified a “Hammer” pattern and bought shares that appreciated 15% in one week.
| Operation | Identified pattern | Return |
|---|---|---|
| Buying Technology Shares | Hammer | 15% |
| Sale of Energy Shares | Shooting Star | 10% |
Success stories show that graphical analysis can provide quick gains, but it is essential to be aware of the risks involved. It's not enough just to look at a graph; you need constant study and practice. It's also important not to get carried away by overconfidence and always consider the market context.
Graphical analysis requires much more than simply looking at charts. You need to understand the risks and be prepared for market fluctuations.
5 Tips for Beginners in Chart Analysis
In addition to the recommendations above, we have listed 5 important tips for those who want to start investing using graphical analysis.
Conclusion
Graphical analysis, when used in a conscious and informed manner, can be a powerful ally when making investment decisions. It allows you to identify trends and patterns that can indicate the best times to buy or sell assets, helping you to maximize profits and manage risks. However, it is essential to remember that this methodology must be complemented with other techniques, such as fundamental analysis, in order to obtain a more complete and secure view of the market. Therefore, when incorporating graphical analysis into your investment strategy, always be aware of the risks and continually seek to improve your knowledge in order to make increasingly assertive decisions.
Frequently Asked Questions
What is graphical analysis?
Graphical analysis, also known as technical analysis, is a methodology used to predict future price movements of financial assets based on the study of charts and historical patterns.
What is the difference between graphical analysis and fundamental analysis?
While graphical analysis focuses on price patterns and trading volume, fundamental analysis focuses on the economic and financial fundamentals of a company to determine its intrinsic value.
What are the main tools of graphical analysis?
Some of the main tools include moving averages, the relative strength index (RSI) and Bollinger bands.
How to interpret price charts?
To interpret price charts, it is important to understand the different types of charts, such as line, bar and candlestick charts, as well as identifying patterns and support and resistance levels.
What are the advantages of graphical analysis?
Graphical analysis enables quick decision-making, helps to identify trends and offers the flexibility to be used in different markets.
What are the limitations and risks of graphical analysis?
Among the limitations are the possibility of false signals, the dependence on historical data and the risk of overinterpretation of the graphs.
How to integrate graphical and fundamental analysis?
Integrating the two approaches can offer a more complete view of the market, combining the analysis of price patterns with the evaluation of companies' economic fundamentals.
What are the common mistakes when using graphical analysis?
Some common mistakes include ignoring the market context, being overconfident in forecasts and neglecting risk management.